

Intro
You can manage DataSets and user accounts for connectors in the Data Center. Access the Data Center by selecting Data in the Domo navigation.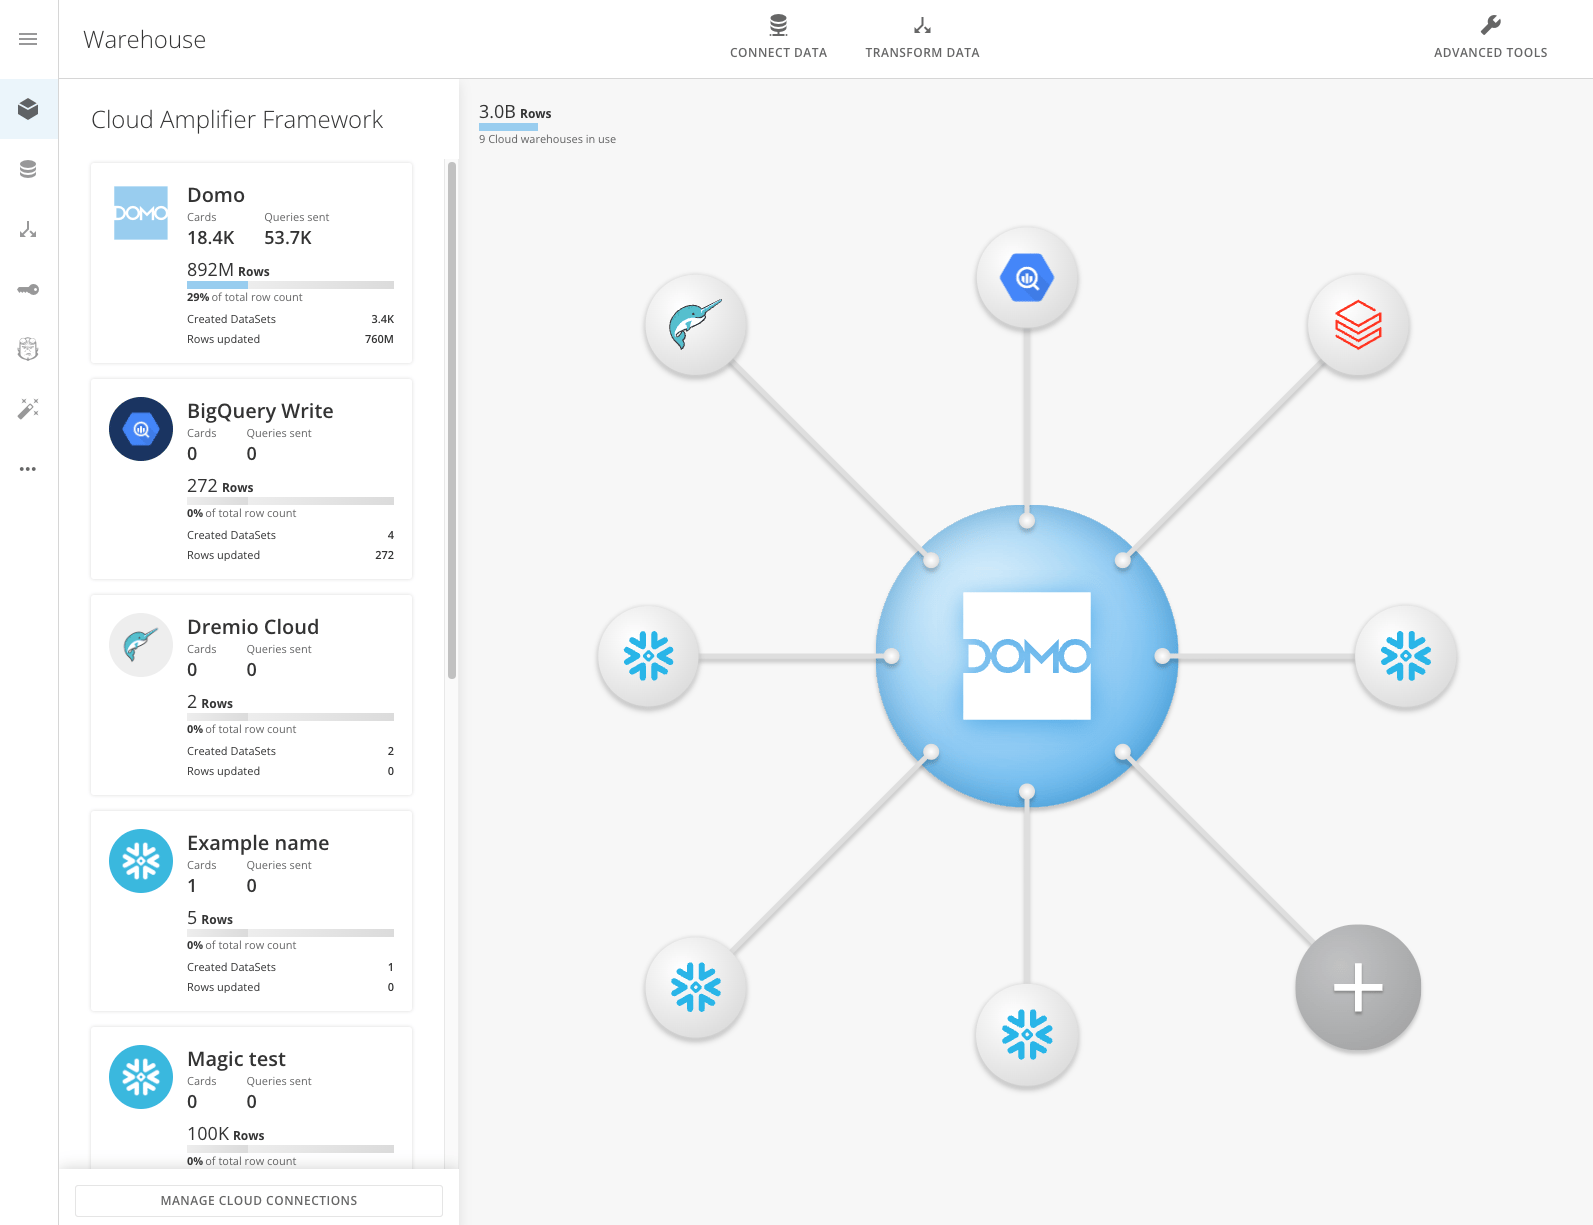
| Tab | Icon | Description |
|---|---|---|
| Data Warehouse |  | See a three-dimensional visual representation of all DataSets in your Domo broken down by connector. |
| DataSets |  | View and manage DataSets added to Domo. For any DataSet, you can access a Details page that provides additional options. |
| DataFlows |  | Create and manage DataFlows, DataSets created by combining and transforming two or more input DataSets. |
| Accounts |  | Manage accounts used for connecting DataSets to Domo. |
| Beast Mode Manager |  | View and manage Beast Modes created on your Cards. |
| Data Science |  | View the Data Science Home Page to find the tools you need. |
| More |  | View additional options that are enabled in your instance. |
 icon to show the names of the above tabs.
Data Warehouse
The Data Warehouse in Domo provides a three-dimensional visual representation of all DataSets in your Domo, broken down by connector, along with data currently flowing into and between them. DataSets for each connector type are represented as stacks on a rotating palette. You can configure the order and height of the connector stacks to indicate different metrics. For example, you could sort the connector stacks by number of rows but have the height of the individual stacks represent the number of DataSets. For more information about The Data Warehouse, see Using The Data Warehouse to Manage Data. In the Data Warehouse tab you have access to a toolbar that provides shortcuts for opening the DomoR installation page.DataSets and DataFlows tabs
The DataSets and DataFlows tabs list DataSets and DataFlows, respectively, in your Domo instance. In these tabs you can- view DataSets and DataFlows that have been added to Domo For a DataSet, you can view information about the DataSet, including the connector, the name, the owner, the number of rows and columns in the DataSet, the number of cards being powered by the DataSet, the total number of times these cards have been viewed, and the amount of time since the DataSet was last updated. You can also preview or delete a DataSet. For a DataFlow, you can view information about the DataFlow, including the name, owner, number of input and output DataSets, number of runs vs. success rate, and the amount of time since the DataFlow was last run. Both tabs include options for searching with or without filters, applying quick filters, saving favorite filters, and sorting the DataSets/DataFlows in the list.
-
add DataSets and DataFlows
From either tab you can…
- add data into Domo from third-party systems, then transform the data to power up multiple cards without having to locate and re-upload that DataSet for each card.
- add Magic transforms of any kind—DataFusions.
- get information about and download Workbench.
- get information about installing the DomoR plugin.
- visually identify DataSets needing attention DataSets with errors do not run as scheduled until errors are resolved. Domo lets you know when a DataSet cannot run successfully by displaying the error on the DataSet in the Data Center and in the Accounts page, and by sending the owner of the DataSet an alert that describes the error and links to the DataSet.
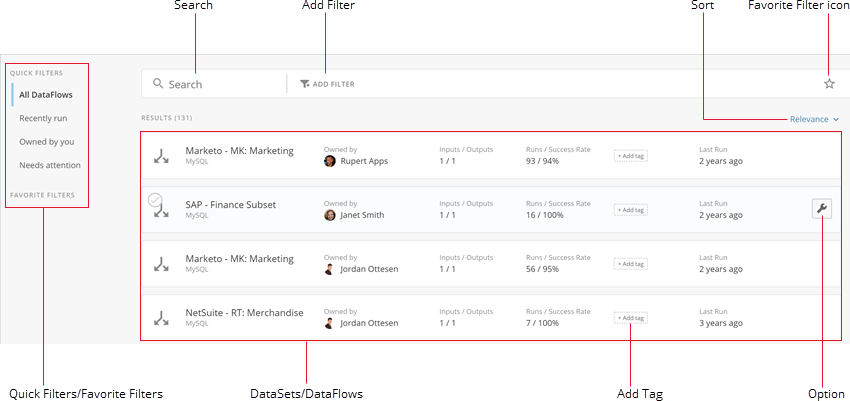
| Name | Description |
|---|---|
| Search | Lets you search for the desired DataSet/DataFlow in the list. This search draws from a variety of metadata, including name, connector, owner, tags, status, and more. You can refine your search by doing any of the following: - Clicking a recommended filter. These may appear when you enter a search term or part of search term in the field.  - Adding a custom filter. You do this by clicking Add Filter, selecting the desired filter from the list, then entering the filter criteria as required. For example… - If you selected Owned****By, you would be prompted to enter the owner of the DataSet or DataFlow you wanted to view. - If you selected DataFlow Type, you would be prompted to select the desired DataFlow type from a list. - If you selected Last Updated, you would be prompted to specify whether the DataFlow or DataSet was last updated on, before, or after the given date, then select the date itself. - Changing the sort used in the list. You do this by clicking in the menu in the top right corner of your search results (shown as “Relevance” in the above screenshot) then choosing the desired sort type. For DataSets, you can sort by relevance, name, number of cards, number of rows, last run date, or status (broken DataSets are shown first). For DataFlows, you can sort by relevance, creation date, last modified date, name, status (broken DataFlows are shown first), success rate, or last run date. - Adding a custom filter. You do this by clicking Add Filter, selecting the desired filter from the list, then entering the filter criteria as required. For example… - If you selected Owned****By, you would be prompted to enter the owner of the DataSet or DataFlow you wanted to view. - If you selected DataFlow Type, you would be prompted to select the desired DataFlow type from a list. - If you selected Last Updated, you would be prompted to specify whether the DataFlow or DataSet was last updated on, before, or after the given date, then select the date itself. - Changing the sort used in the list. You do this by clicking in the menu in the top right corner of your search results (shown as “Relevance” in the above screenshot) then choosing the desired sort type. For DataSets, you can sort by relevance, name, number of cards, number of rows, last run date, or status (broken DataSets are shown first). For DataFlows, you can sort by relevance, creation date, last modified date, name, status (broken DataFlows are shown first), success rate, or last run date. |
| Add Filter | Lets you filter the DataSets or DataFlows in the list. This option is described in more detail in the entry for “Search,” above. |
| Favorite Filter icon | Lets you save the current filter configuration. When you click this icon, you are prompted to enter a unique name for the filter. When you save the new filter, the star icon turns gray and the filter appears under Favorite Filters in the panel on the left side of the screen. You can then click this filter anytime to apply it. You can remove a saved filter by clicking the gray star icon and then choosing Remove. You can also do a “Save As” on a saved filter. This is useful when you make changes to an existing filter and want to keep both filters. To do this, you click on the gray star icon, enter the new filter name in the name field, click Update, then select Save As New Filter. These options are also available via the Favorite Filters area in the panel on the left side of the screen. If you mouse over a filter here, a gear icon displays. Clicking this icon reveals the following options: - Rename. Lets you rename a saved filter. - Duplicate. Lets you do a “Save As” on the filter. When you save the filter in this way, a second version of the filter appears in the list, with the word “copy” appended to it. You can rename it if you want using the Rename option described above. - Delete. Removes the filter. |
| Sort | Lets you sort the DataSets or DataFlows in the list. This option is described in more detail in the entry for “Search,” above. |
| Quick Filters/Favorite Filters | Lets you quickly apply any prebuilt filters (Quick Filters) or saved filters (** Favorite Filters**). Available Quick Filters include the following: - All DataSets/All DataFlows. Removes all filters from the list. This is a good way to “reset” the list after you have applied many filters. - Recently run. Filters to show only those DataSets/DataFlows that have been run in the last several days. - Owned by you. Filters to show only those DataSets/DataFlows you are the owner of. - Needs attention. Filters to show only those DataSets/DataFlows in a broken state (indicated by a red exclamation point on the DataSet/DataFlow in the list). Favorite Filters are those filter configurations you have saved. These are described in more detail in the entry for “Favorite Filter icon,” above. |
| DataSets/DataFlows | Display information about each DataSet or DataFlow. For DataSets, this information includes the name, connector, owner profile picture, number of rows and columns, number of cards powered by the DataSet, any tags, and the last update time. For DataFlows, the information includes the name, owner, number of input and output DataSets, number of runs versus the success rate, any tags, and the last run time. For each DataSet or DataFlow, you can do the following: - Click the photo to open a user avatar card with information, including a list of groups to which the user belongs, card view statistics, and a Follow button so you can follow this user in Buzz. - Click the DataSet or DataFlow name to open the details view for the DataSet or DataFlow, which provides additional options. For example, for a DataSet, you can see a preview of the data, cards being powered by the DataSet, a run history, and so on. - Mouse over the row to reveal a wrench icon  that provides access to various options for interacting with this DataSet or DataFlow. These options are listed in the entry for “Options,” beow. - Add search tags to this DataSet or DataFlow so you can more easily find it later. This is described in more detail in the entry for “Add Tag,” below. - Take bulk actions on DataSets or DataFlows. You can select an initial DataSet or DataFlow to take action on by mousing over the row then clicking the checkbox that appears in the top left corner of that row. This pops up a blue bar along the top of the screen with new options. From here you can do all of the following: - Select more DataSets/DataFlows by mousing over them and checking their checkboxes. - Select all DataSets/DataFlows currently appearing in the list by clicking Select All in the blue bar. - Tag selected DataSets/DataFlows by clicking the that provides access to various options for interacting with this DataSet or DataFlow. These options are listed in the entry for “Options,” beow. - Add search tags to this DataSet or DataFlow so you can more easily find it later. This is described in more detail in the entry for “Add Tag,” below. - Take bulk actions on DataSets or DataFlows. You can select an initial DataSet or DataFlow to take action on by mousing over the row then clicking the checkbox that appears in the top left corner of that row. This pops up a blue bar along the top of the screen with new options. From here you can do all of the following: - Select more DataSets/DataFlows by mousing over them and checking their checkboxes. - Select all DataSets/DataFlows currently appearing in the list by clicking Select All in the blue bar. - Tag selected DataSets/DataFlows by clicking the  icon on the right side of the blue bar. For more information about tagging, see the entry for “Add Tag” in this table. - Apply additional actions by clicking the icon on the right side of the blue bar. For more information about tagging, see the entry for “Add Tag” in this table. - Apply additional actions by clicking the  icon on the right side of the blue bar then selecting the desired option: - Run Now. This executes all of the selected DataSets or DataFlows. - Change Owner. This allows you to select a new owner for the selected DataSets or DataFlows. For more information, see Changing the Owner of a DataFlow. - Delete. This allows you to delete all of the selected DataSets or DataFlows. To delete DataSets you must have an “Admin” security profile or be the DataSet owner. For more information, see Disabling or Deleting a DataFlow. For a DataFlow, you can also mouse over the “Inputs/Outputs” data to show all of the input and output DataSets for this DataFlow. icon on the right side of the blue bar then selecting the desired option: - Run Now. This executes all of the selected DataSets or DataFlows. - Change Owner. This allows you to select a new owner for the selected DataSets or DataFlows. For more information, see Changing the Owner of a DataFlow. - Delete. This allows you to delete all of the selected DataSets or DataFlows. To delete DataSets you must have an “Admin” security profile or be the DataSet owner. For more information, see Disabling or Deleting a DataFlow. For a DataFlow, you can also mouse over the “Inputs/Outputs” data to show all of the input and output DataSets for this DataFlow. |
| Add Tag | Lets you add search tags to this DataSet or DataFlow so you can easily find it later by searching for those tags. When you click Add tag, a dialog appears with a list of existing tags. (If no tags have yet been added for your company, this list appears blank.)  You can then do either of the following: - Add existingtags to the DataSet or DataFlow by clicking them in the list. Any tags that have already been added appear blue. You can filter the tags in the list by entering the desired tag name in the Search and add tags field. - Add a new tag to the DataSet or DataFlow by entering the tag name in the Search and add tags field. If the tag does not yet exist, it appears alone in the list area with the “Create new tag” designation. You can then click it to add it to the DataSet or DataFlow. You can remove a tag from a DataSet or DataFlow by clicking the “x” next to the tag while in this dialog. You can also access the tagging functionality by doing any of the following: - Selecting View Tags in the options menu for a DataSet or DataFlow in the list view. - Selecting Tags in the options menu for a DataSet or DataFlow details view. - Clicking Add tag under the DataSet name in the details view (DataSets only). You can add tags to multiple DataSets or DataFlows at once by selecting the DataSets or DataFlows (by checking their checkboxes), clicking to open the tagging dialog, then adding tags as desired. For more information about this dialog, see the entry for “Add Tag” in this table. While in the list view for a DataSet or DataFlow, if you click a tag, the list filters to show only DataSets and DataFlows with that tag. You can then do either of the following: - Add existingtags to the DataSet or DataFlow by clicking them in the list. Any tags that have already been added appear blue. You can filter the tags in the list by entering the desired tag name in the Search and add tags field. - Add a new tag to the DataSet or DataFlow by entering the tag name in the Search and add tags field. If the tag does not yet exist, it appears alone in the list area with the “Create new tag” designation. You can then click it to add it to the DataSet or DataFlow. You can remove a tag from a DataSet or DataFlow by clicking the “x” next to the tag while in this dialog. You can also access the tagging functionality by doing any of the following: - Selecting View Tags in the options menu for a DataSet or DataFlow in the list view. - Selecting Tags in the options menu for a DataSet or DataFlow details view. - Clicking Add tag under the DataSet name in the details view (DataSets only). You can add tags to multiple DataSets or DataFlows at once by selecting the DataSets or DataFlows (by checking their checkboxes), clicking to open the tagging dialog, then adding tags as desired. For more information about this dialog, see the entry for “Add Tag” in this table. While in the list view for a DataSet or DataFlow, if you click a tag, the list filters to show only DataSets and DataFlows with that tag. |
| Options icon | Displays a menu of options for the DataSet or DataFlow. Appears when you mouse over the row for a DataSet or DataFlow. For a DataSet, available options are as follows: - View Details. Opens the Details view for this DataSet. In this view you can see an overview of the DataSet, previews of the cards powered by the DataSet, and a run history. - View Tags. Opens the tag dialog for this DataSet. For more information, see “Add Tag” in this table. - Preview. Opens a preview of the data in this DataSet. - Delete. Deletes this DataSet. You can delete DataSets owned by other users only if you have an “Admin” security role or a custom role with the “Manage DataSets” privilege enabled. For information about custom roles, see Managing Roles. For a DataFlow, available options are as follows: - Details. Opens the Details view for this DataFlow. In this view you can set scheduling options, view input and output DataSets, see the run history, and access a list of previous versions of the DataFlow. - Edit. Opens the editor for the DataFlow. - View Tags. Opens the tag dialog for this DataFlow. For more information, see “Add Tag” in this table. - Run. Runs this DataFlow, which updates the input and output DataSets. For more information, see Running a DataFlow. - Disable. Disables the DataFlow, preventing DataSets powered by the DataFlow from running. For more information, see Disabling or Deleting a DataFlow. - Notifications. Lets you choose whether you want to receive email notifications when the DataFlow fails to update. For more information, see Configuring Notifications for Failed DataFlows. - Create Copy. Does a “Save As” on this DataFlow. Copied DataFlows can be renamed, edited, saved, and run independently of their original DataFlow. For more information, see Copying a DataFlow. - Delete. Deletes this DataFlow. You can delete DataFlows owned by other users only if you have an “Admin” security role or a custom role with the “Manage DataFlows” privilege enabled. For information about custom roles, see Disabling or Deleting a DataFlow. |
- You can view DataSets for a specific third-party application or data provider from the Launcher page.
- In the Profile page, you can view all of the DataSets owned by a user.
View Details
When you click the name of a DataSet or click > View Details, a page appears showing details for the DataSet. This page is divided into a number of tabs. Some of these tabs appear for every DataSet you view, while others only appear for specific user roles and connector types. These tabs are Overview, C****ards, History, Settings, Data Lineage, and Personalized Data Permissions.
For more information, see Adding a DataSet Using a Connector.
Video - Domo Interface - DataSet Details
- The Overview tab includes four tiles that show you the number of cards powered from this DataSet, the number of users it is being shared with, the number of DataSets built from the connector, and the number of DataFlows created from the DataSet. All of these tiles also provide “jump-off points” to other actions in Domo using this DataSet.
- The Cards tab contains previews of cards powered by the DataSet.
- The History tab shows the run history for the DataSet and only appears if the DataSet has run history data.
- The Settings tab lets you change the connector configuration options for the DataSet. It only appears if you are the DataSet owner or have an “Admin” security role or a custom role with the “Manage DataSets” privilege enabled.
- The Data Lineage tab shows you the lineage for this DataSet.
- The Personalized Data Permissions tab allows you to set PDP policies on the DataSet and does not appear unless you are the DataSet owner or have an “Admin” security role or a custom role with the “Manage DataSets” privilege enabled.
General options
The following screenshot shows the details view for a sample DataSet called “College Enrollment.” All of the options called out here are available in all tabs.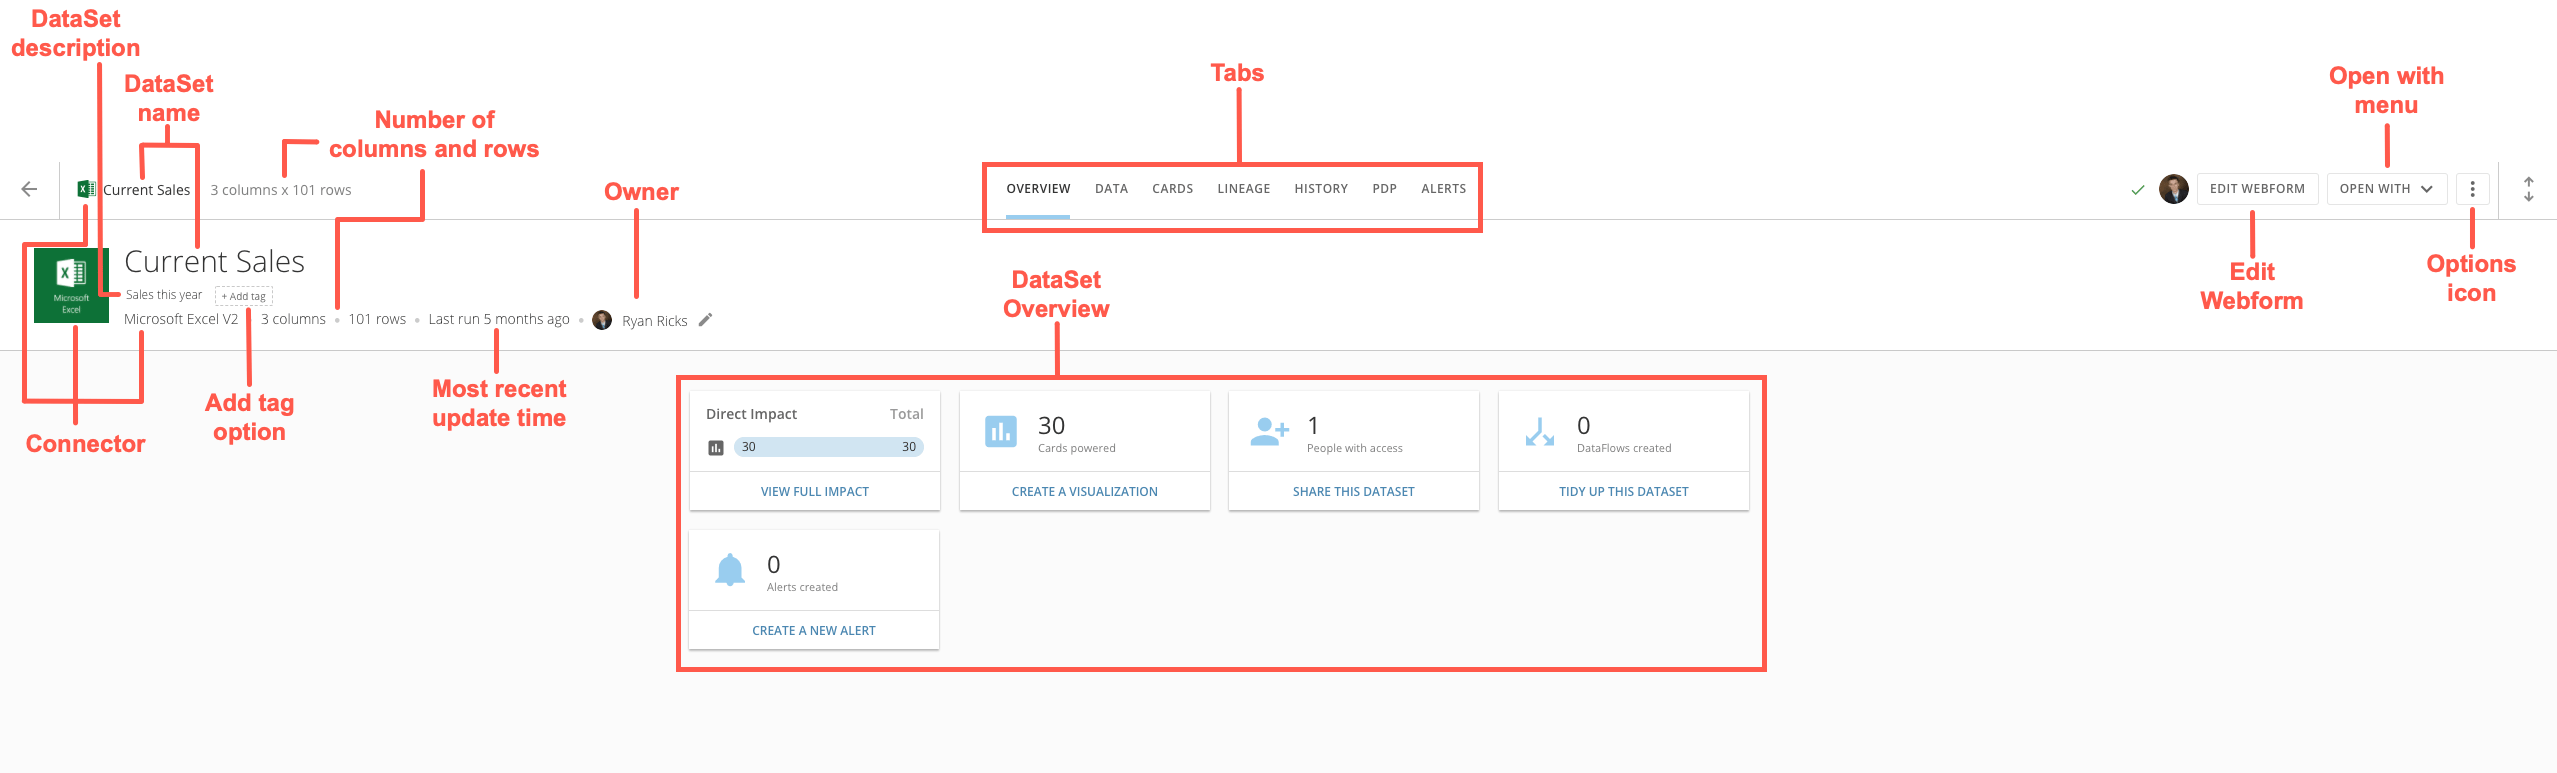
Overview tab
In the Overview tab you can see how the DataSet is being used, the number of Cards powered from this DataSet, the number of users it is being shared with, the number of DataFlows created from the DataSet, and the number of Alerts on the DataSet. All of these tiles also provide “jump-off points” to other actions in Domo using this DataSet. The following screenshot shows an example of these tiles in the Overview tab for a typical DataSet.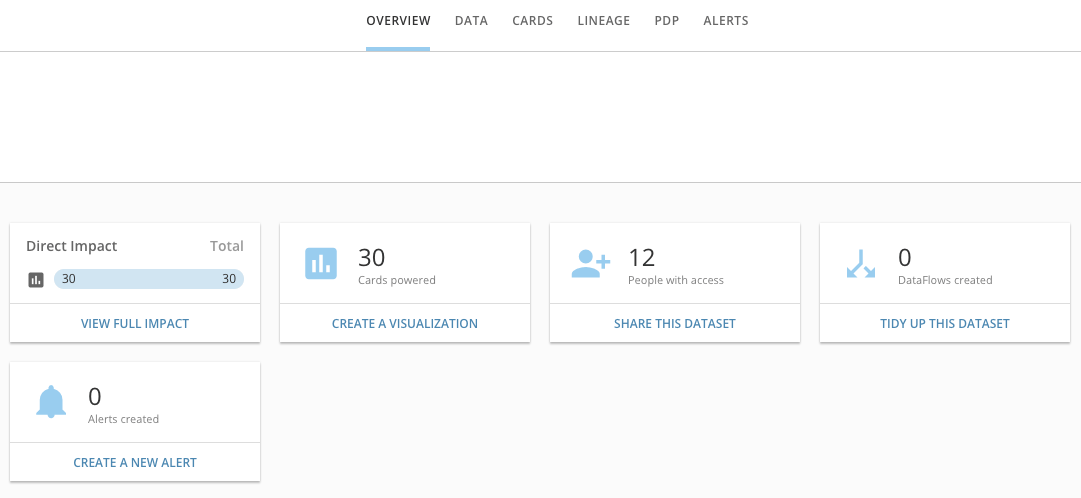
- View Full Impact opens the Lineage tab for the DataSet.
- Create A Visualization opens the Analyzer for this DataSet so you can build a chart or table from it. For more information about Analyzer, see Analyzer Overview.
- Share This DataSet opens the menu to share the DataSet with users.
- Tidy Up This DataSet opens the interface for building an ETL DataFlow using this DataSet.
- Create A New Alert opens the interface for creating an Alert on the DataSet.
Data tab
In the Data tab, you can do all of the following:- View all of the rows in the DataSet, and sort and filter to show the data interests you.
- See statistics for individual columns or for the entire DataSet.
- Change the order of columns in the DataSet.
- Rename columns in the DataSet.
- Add or edit column descriptions.
- Add search tags for columns.
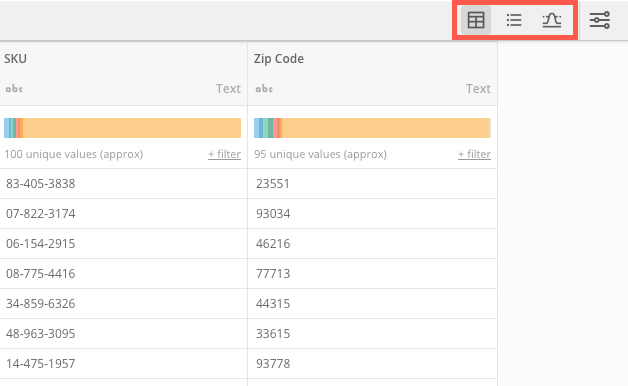
 or restore it to its original size by clicking
Table subtab
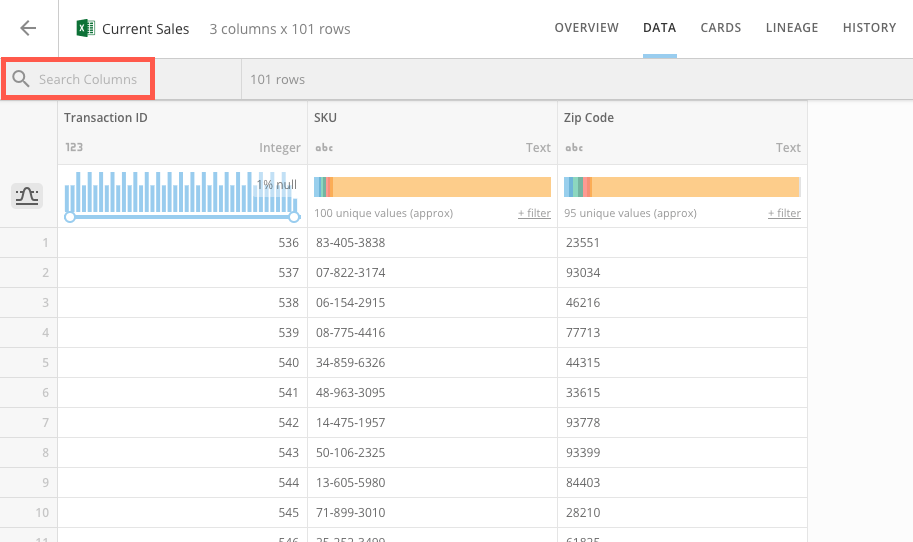
In the Table subtab, you can see all of the columns in your DataSet. Options are available for searching, sorting, and filtering so you can find the data you need. The following screenshot shows the components of the Table subtab:
| Name | Description |
|---|---|
Sort button  | Lets you sort the values in a given field in ascending or descending alphanumerical order. Sorts are “nested” based on the order in which you apply them. The numeral beneath the sort icon tells you the priority of this column in your sort. For example, if a user first applied an ascending sort to the “Transaction ID” column, all of the rows in the DataSet would be ordered in numerical order. If he then applied an ascending sort to the “SKU” column, the groupings of rows for each SKU would be ordered numerically. If he finally applied a third sort, descending, to the “Zip Code” column, those values would be sorted in descending order for each transaction-SKU grouping. The following screenshot shows an example of this behavior: 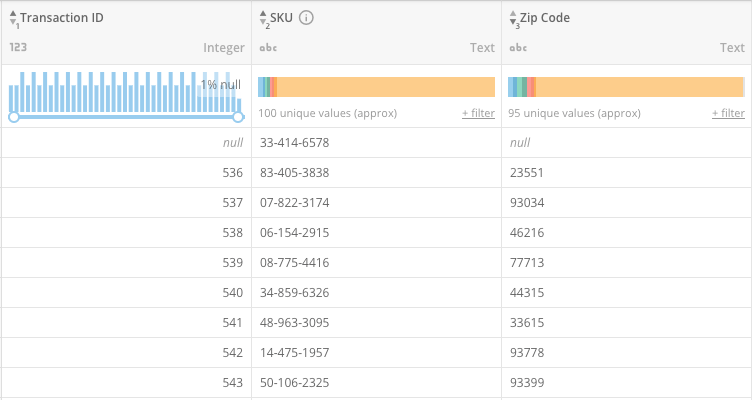 |
Info button  | Shows the description for this column, if you have added one in the Schema subtab. |
| Data type icon | Indicates the data type for this column.  indicates a numeric (value) column, indicates a numeric (value) column,  indicates a date or date-time column, and indicates a date or date-time column, and  indicates a string column. For more information about data types, see Understanding Chart Data. indicates a string column. For more information about data types, see Understanding Chart Data. |
| Filter chart | Lets you filter the data in the DataSet based on the values in a given column. Different chart types appear for columns depending on the data type for that column. For text (string) columns, a horizontal bar appears, divided into segments for each unique name in the column. You can filter the data in the DataSet to a particular name by clicking on that section in the bar. (Names appear as hovers when you mouse over a section.) In the following example, the user could filter the DataSet to show only the data for “Delivery Truck” by clicking on the corresponding bar. 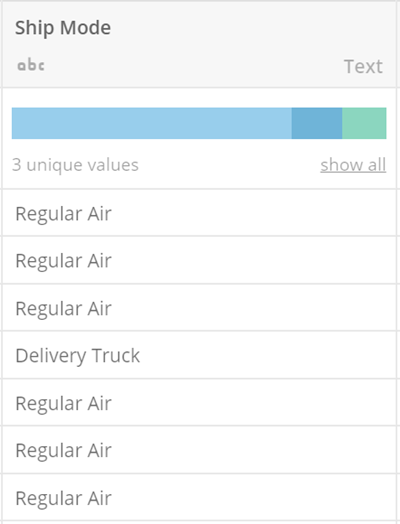 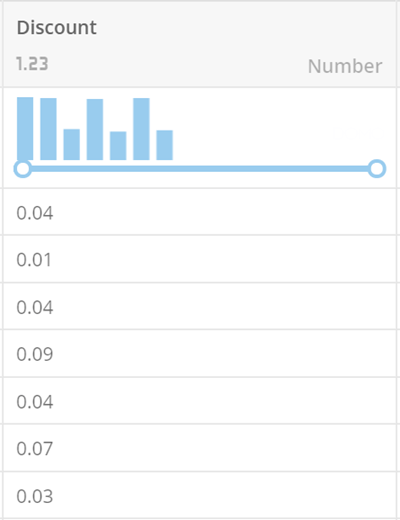 |
Schema subtab
In the Schema subtab, you can reorder the columns in your DataSet, add descriptions and tags, etc. The following screenshot shows the components of the Schema subtab: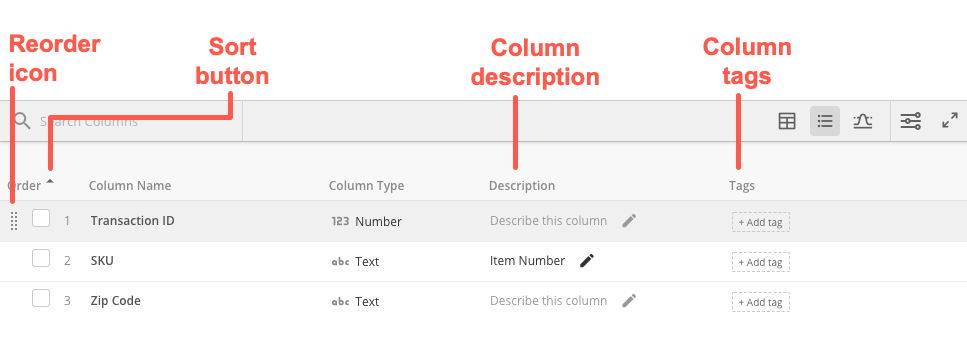
Stats subtab
In the Stats subtab, you can see Domo-generated statistics for the columns in your DataSet. For numeric and date/date-time columns, you can correlate the columns against other numeric columns in the DataSet, and for text columns, you can see the highest aggregated values for the sum or count of any selected column. The following screenshot shows the components of the Schema subtab:
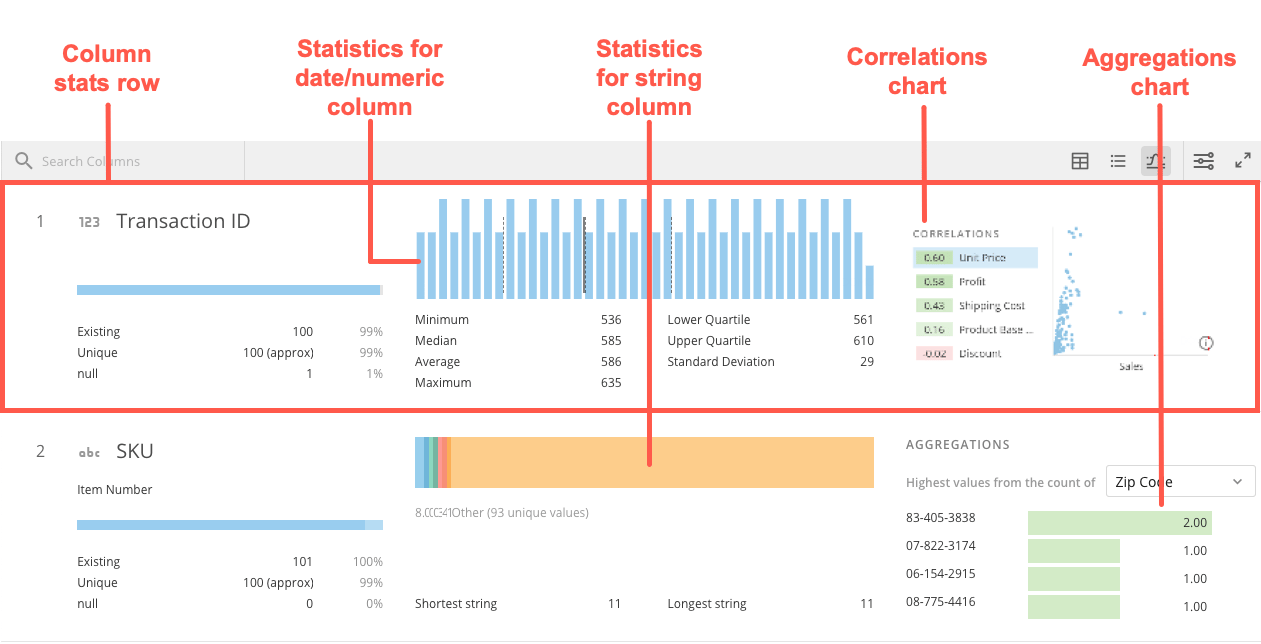
Cards tab
The following screenshot shows the components of the Cards tab: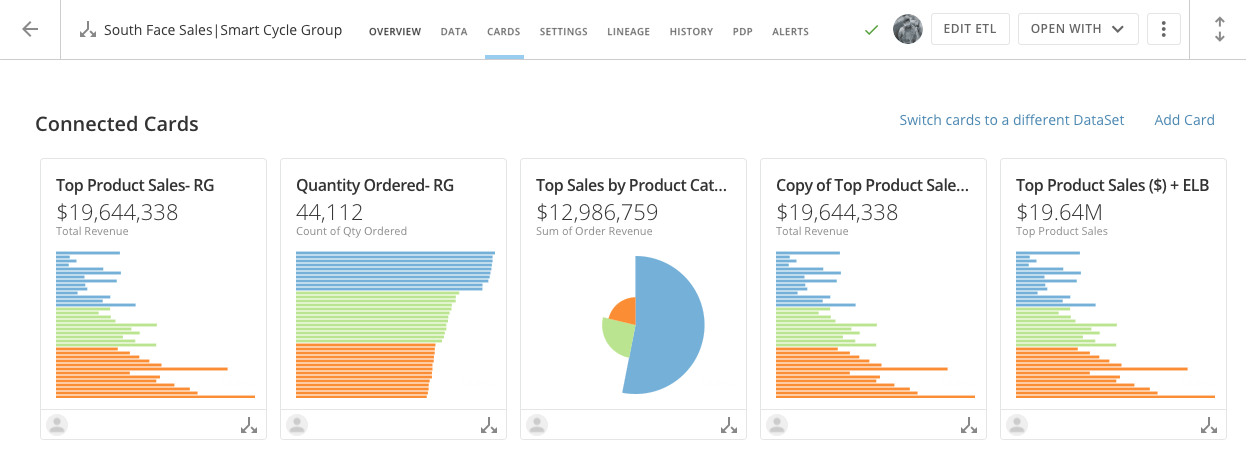
History tab
In the History tab, you can see a listing of all of the times this DataSet has been updated. This tab shows the start and end times for all updates, the amount of time the update took (duration), whether the update was scheduled or manual, and the result of the update (successful or failed). You can also see the amount of time that has transpired since the last successful run, the average update duration, and the overall success rate. Finally, for any history item, several actions are available by mousing over the row and clicking the wrench icon. The following screenshot shows an example of a History tab for a DataSet called “Compensation Costs”: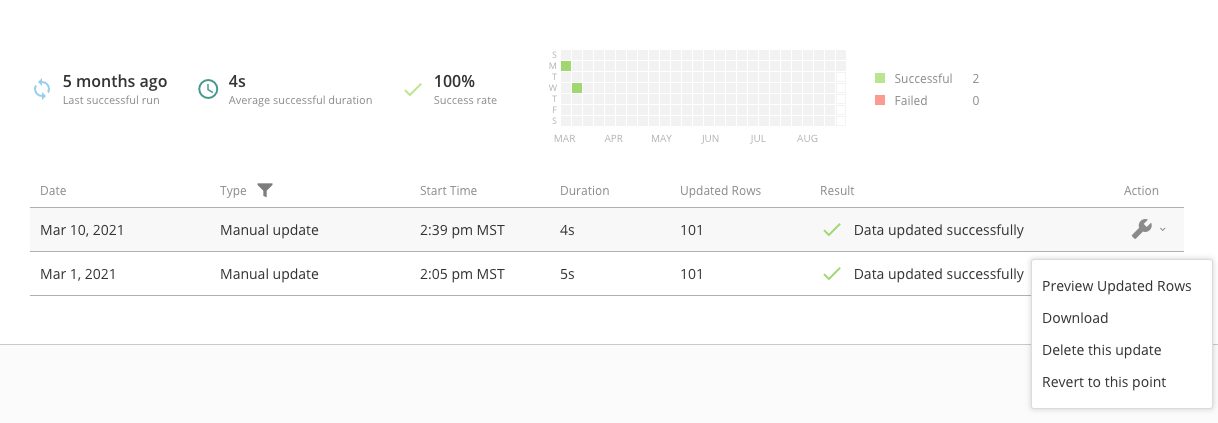
- Preview updated rows. Displays the rows in the DataSet that were changed when this update occurred.
- Download. Downloads the data in this version of the DataSet as a flat text file that can be opened in an Internet browser or word processor.
- Delete this update. Deletes this version of the DataSet from your history.
- Revert to this point. Reverts the DataSet to this version.
Settings tab
In the Settings tab for a DataSet, you have access to the options used to set up this DataSet, similar to the view that appears when you initially configure a connector DataSet. Click a row to open up the settings in that row for viewing and editing. Settings categories may differ between connectors. For more information about connector configuration options, see Adding a DataSet Using a Data Connector.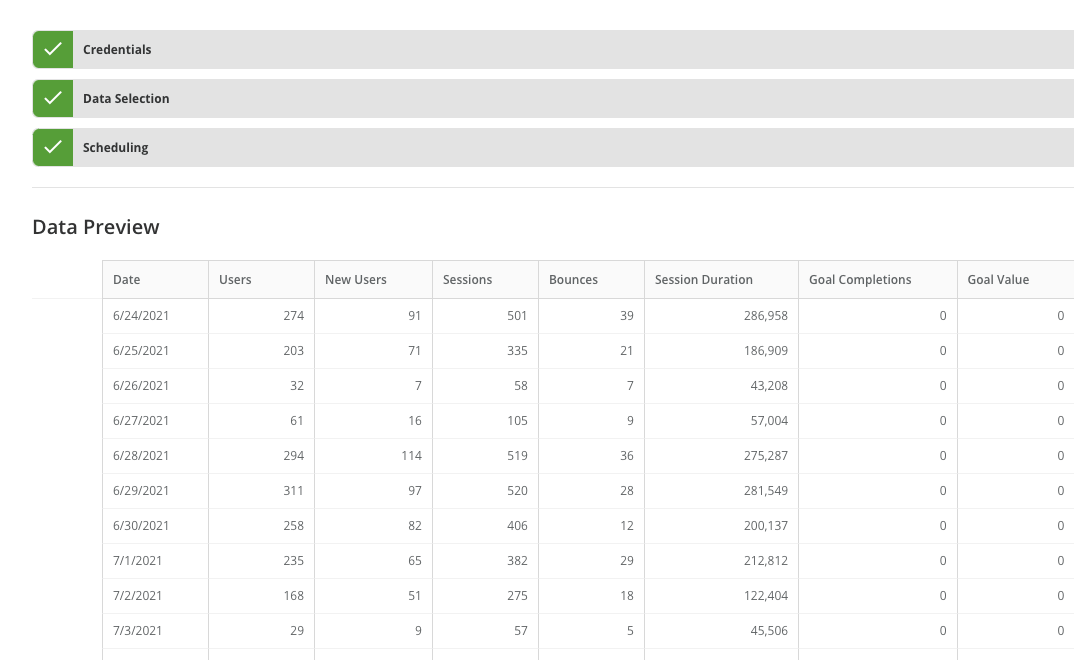
Data Lineage tab
In the Data Lineage tab for a DataSet, you can see the DataSets that have been combined and/or transformed through DataFlows or DataFusion to yield this DataSet. The Data Lineage interface in Data Center is the same as that used for a DataSet in Analyzer. For more information, see Viewing the Lineage of a DataSet in Analyzer.Personalized Data Permissions (PDP) tab
Personalized Data Permissions (PDP) allow you to create a customized experience for each Domo user through the definition of Entitlement Policies. Using Entitlement Policies, you can filter data in a DataSet for specified users and/or groups. For more information, see Personalized Data Permissions (PDP). The following screenshot points out the most important parts of the PDP tab: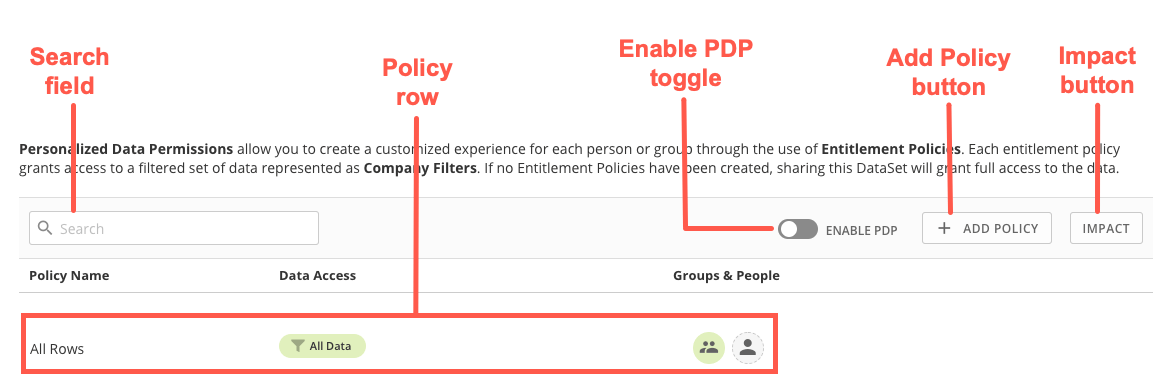
View Details (DataFlows)
When you click the name of a DataFlow or click > View Details, a page appears showing details for the DataFlow. This page is divided into tabs—** Settings**, DataSet****s, History, and Versions. For more information about these tabs, see Viewing DataFlow Details.
Editor view (MySQL and Redshift DataFlows)
The following screenshot shows you the main components of the Create/** Edit DataFlow** view for a MySQL or Redshift DataFlow.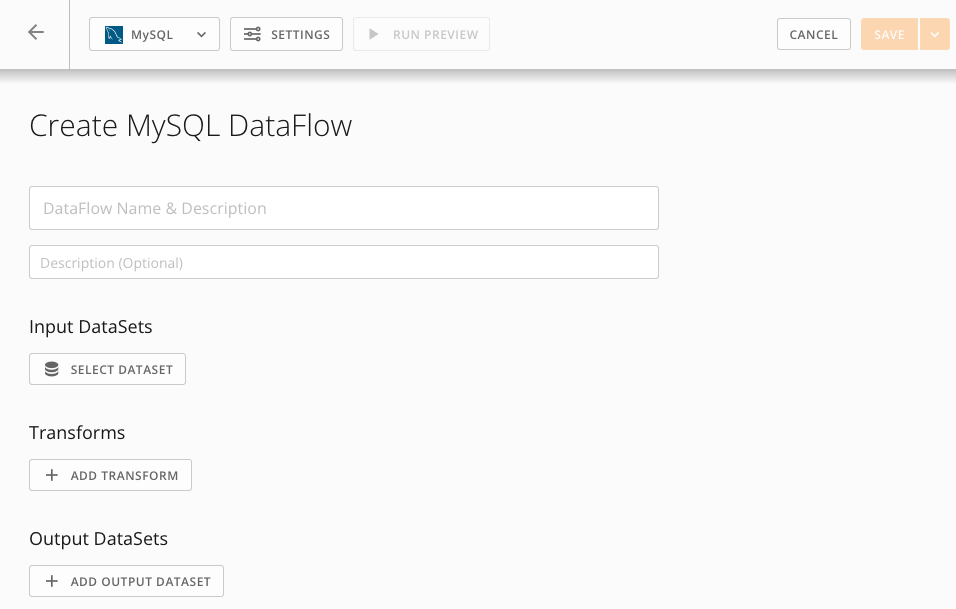
| Name | Description |
|---|---|
| DataFlow Type & Info | When collapsed, this panel displays the type of DataFlow and the schema. When expanded (by clicking  ), this panel displays information about the RDS instance for this DataFlow, including the host name, schema, user name, password, and port number. You can copy and paste this information into any SQL tool, including Workbench. ), this panel displays information about the RDS instance for this DataFlow, including the host name, schema, user name, password, and port number. You can copy and paste this information into any SQL tool, including Workbench. |
| DataFlow Name & Description | Allows you to specify a name and description for this DataFlow. |
| Input DataSets | Allows you to select one or more existing DataSets for use in creating DataFlows. You can choose as many input DataSets as you want. For any given transform or output, you can use one, some, or all of the DataSets you select here. This is essentially a storage area for DataSets you may potentially use. You cannot manipulate data in the DataSets at this stage. You also cannot select the same input DataSet twice in the same DataFlow. Note: Input DataSets in a DataFlow must already exist in Domo; you cannot upload new DataSets in the Create DataFlow view. For information about uploading new DataSets to Domo, see Adding a DataSet Using a Data Connector. You can click an input DataSet you have added to see a preview of the DataSet. |
| Transforms | Allows you to manipulate data in your input DataSets using SQL statements before you make your final manipulations in the Output DataSets stage. The Transforms stage is optional. All input DataSets you have selected are available for use in transforms. |
| Output DataSets | Allows you to specify how your input DataSets are to be combined to produce one or more output DataSets. This interface is almost the same as that of Transforms. However, while adding transforms is optional, the Output DataSets stage is required; otherwise you cannot save your DataFlow. All input DataSets and transforms you have selected/created for this DataFlow are available to be used in your Output DataSet SQL. |
| Save buttons | Allow you to save this DataFlow. Two separate buttons are available: Save and Save and Run. Save saves changes you have made to this DataFlow and adds it to the DataFlows listing in the Data Center but does not generate a DataSet (or, if you are editing an existing DataFlow, it does not update the output DataSets). Save and Run saves changes to the DataFlow and adds it to the DataFlows listing in the Data Center and runs the script for the DataFlow to output a DataSet (or update the output DataSets if it has already been created). |
Editor view (Magic ETL DataFlows)
For times when you need to transform your DataSets before you can make compelling visualizations, you can use Magic ETL DataFlows to transform multiple DataSets into a new DataSet that you can use to power up cards. Magic ETL DataFlows let you visually define and sequence operations to transform your Domo DataSets—without learning SQL or leaving Domo. For information about the Magic ETL DataFlow tiles, see all of the following:- Creating a Magic ETL v2 DataFlow
- Magic ETL v2 Tiles: DataSets
- Magic ETL v2 Tiles: Text
- Magic ETL v2 Tiles: Dates and Numbers
- Magic ETL v2 Tiles: Utility
- Magic ETL v2 Tiles: Filter
- Magic ETL v2 Tiles: Combine Data
- Magic ETL v2 Tiles: Aggregate
- Magic ETL v2 Tiles: Pivot
- Magic ETL v2 Tiles: Scripting
- Magic ETL v2 Tiles: Data Science
- Magic ETL v2 Tiles: Performance
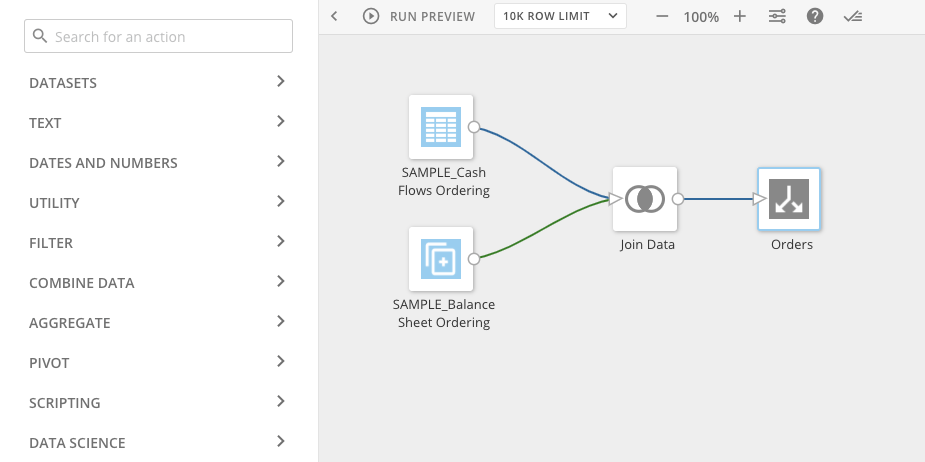
| Element | Description |
|---|---|
| Action pane | Contains the transform tile you can drag and drop into the canvas to use in transforming data. For more information, see the following topics: - Creating a Magic ETL v2 DataFlow - Magic ETL v2 Tiles: DataSets - Magic ETL v2 Tiles: Text - Magic ETL v2 Tiles: Dates and Numbers - Magic ETL v2 Tiles: Utility - Magic ETL v2 Tiles: Filter - Magic ETL v2 Tiles: Combine Data - Magic ETL v2 Tiles: Aggregate - Magic ETL v2 Tiles: Pivot - Magic ETL v2 Tiles: Scripting - Magic ETL v2 Tiles: Data Science - Magic ETL v2 Tiles: Performance |
| Canvas | Contains your transformation flow—the sequence of tiles to perform on input DataSets to save as an output DataSet. You connect tiles to sequence them and select tiles to configure them. |
 | Lets you preview the transform tile. |
 | Lets you schedule the Magic ETL DataFlow to run whenever the specified input DataSets change. |
 | Lets you show or hide the Magic ETL DataFlow checklist, which shows a list of things to do before you can save a Magic ETL DataFlow. |
ETL DataFlow checklist
The checklist shows a list of things to do before you can save a Magic ETL DataFlow. You can show the checklist by clicking at the top of the canvas. The following example illustrates essential tasks to perform before saving a Magic ETL DataFlow.
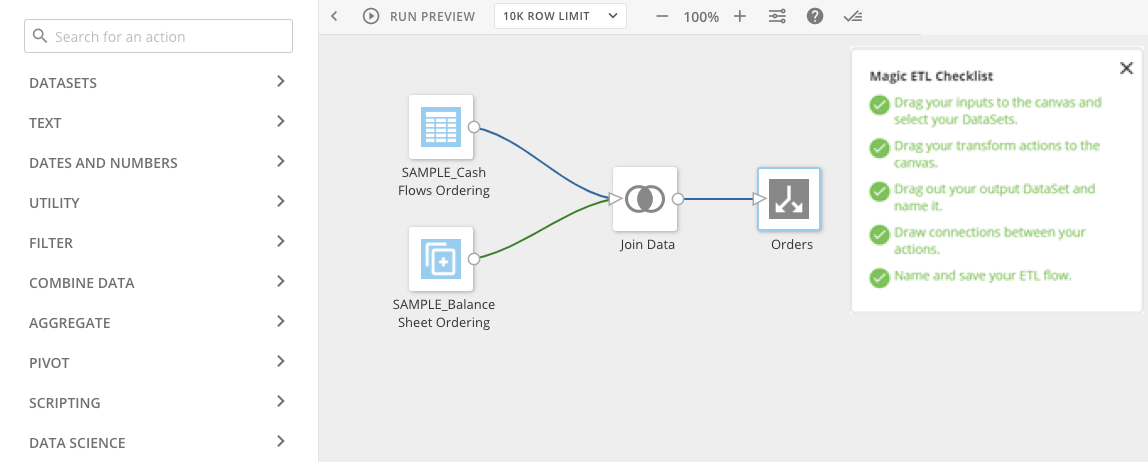
- Create a Magic ETL Dataflow.
- From the tiles pane on the left, drag Input DataSet tiles to the canvas and select the DataSets to transform.
-
Drag transform tiles to the canvas.
For more information, see the following topics:- Creating a New Magic ETL DataFlow
- New Magic ETL Tiles: DataSets
- New Magic ETL Tiles: Text
- New Magic ETL Tiles: Dates and Numbers
- New Magic ETL Tiles: Utility
- New Magic ETL Tiles: Filter
- New Magic ETL Tiles: Combine Data
- New Magic ETL Tiles: Aggregate
- New Magic ETL Tiles: Pivot
- New Magic ETL Tiles: Scripting
- New Magic ETL Tiles: Data Science
- New Magic ETL Tiles: Performance
- Drag an Output DataSet tile to the canvas, then name the DataSet to be output from your transformed data.
- Draw connections between the transform tiles to build a DataFlow that defines and sequences operations to transform the input DataSets (clean, aggregate, join, etc.).
-
(Optional) Configure settings for when the DataFlow runs.
By default, the DataFlow runs in the cloud whenever the specified input DataSets change. - Name and save your Magic ETL Dataflow.
Accounts tab
In the Accounts tab, you can manage third-party system accounts associated with DataSets in Domo. You can view accounts associated with DataSets; add, edit, or delete accounts; and associate DataSets with another account. In the Accounts tab, you can- add user accounts for different connectors (similar to a DSN)
- view a list of user accounts you have added
- disconnect accounts you have added
- share accounts with other users
- see DataSets you have access to
- transfer DataSets from one account to another account
- change account associations
- rename accounts
- visually identify DataSets needing attention
- edit credentials for accounts that require manual authentication (as opposed to those that use OAuth)
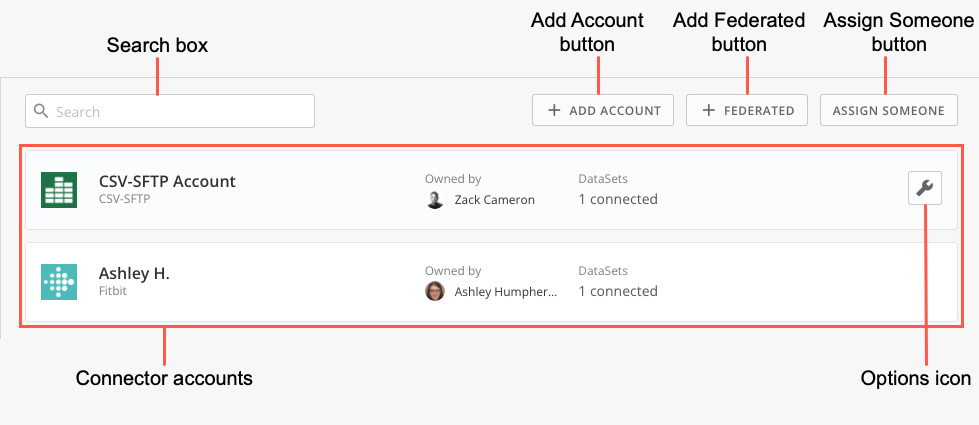
| Name | Description |
|---|---|
| Search box | Lets you filter the accounts in the list. |
| Add Account button | Lets you add a new user account to this list. |
| Add Federated button | Lets you add a Federated account to this list. |
| Assign Someone button | Lets you assign someone to create an account for a specific Connector. |
| Connector accounts | Provide information and options for all accounts you have used to connect to data sources, including the account name, the usernames or handles you use to connect, and options such as share, reconnect, etc. For each account, you can ado the following: - Click an account to open a panel in which you can edit the account information. For all accounts, you can edit the name. For non-OAuth accounts (those in which you must authenticate manually), you can also edit the account credentials. - Mouse over the DataSets item to see a list of DataSets powered by this account. These are categorized according to whether they are owned by you or another user. You can click a DataSet to open the Details view for that DataSet. You can also transfer ownership of the account to another user or change the account credentials for multiple DataSets. - Mouse over the account to display the Options icon. |
| Options icon | Lets you access various options for working with this account, including the following: - Edit account. Lets you edit the name and credentials for this account. - Share account. Lets you share user accounts with others so they can access the DataSets through the connector. - Reconnect. Lets you reconnect any connectors that use oAuth for authentication. If the connector requires manual authentication, this icon does not appear. - Delete account. Lets you remove an account, in which case any associated DataSets depending on the account to power up cards may stop functioning. |
Beast Mode Manager tab
In the Beast Mode Manager tab in the Data Center, you can view statistics on Beast Mode usage as well as perform various actions, such as editing formulas, locking and unlocking calculations, deleting unwanted calculations, and so on. The following screenshot calls out the most important parts of the main screen (Overview) of the Beast Mode Manager tab: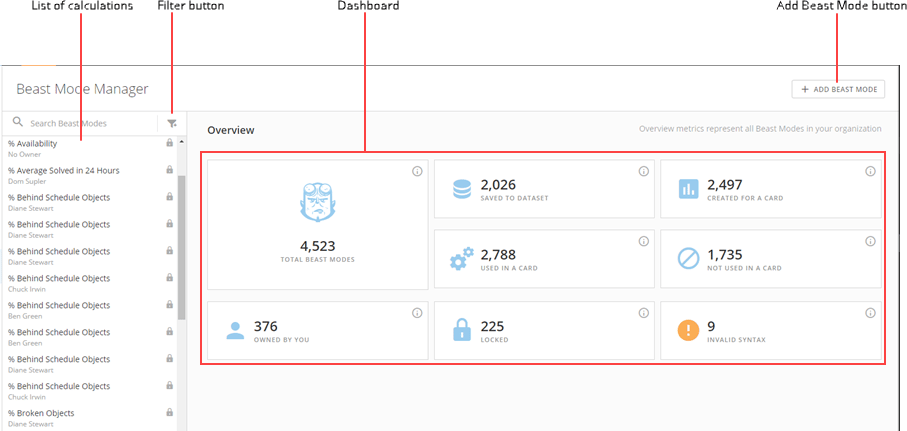
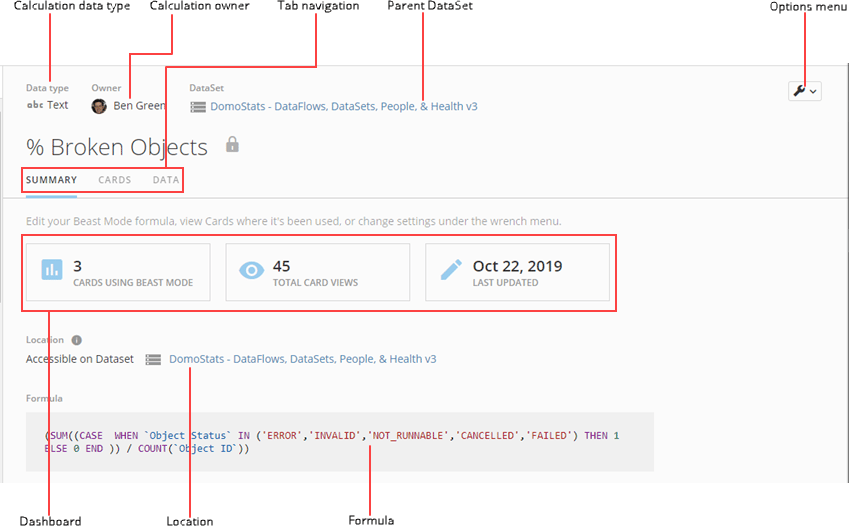
If you click on a calculation in the list on the left, a details view for that calculation appears. Here you can see information specific to the calculation and access additional options. The following screenshot points out the most important parts of this view:
Video - Data Center Overview